April 2025
Five in Five is a monthly publication where we share graphs around five topics that illustrate the current state of the markets, with brief commentary that can be absorbed in five minutes or less.
This month's topics include:
- Fixed Income Returns
- Sector Returns
- Treasury Yields
- Growth Stocks Underperform Q1 2025
- The S&P 500 and the Terrible, Horrible, No Good, Very
Bad Two Days (April 3-4, 2025)
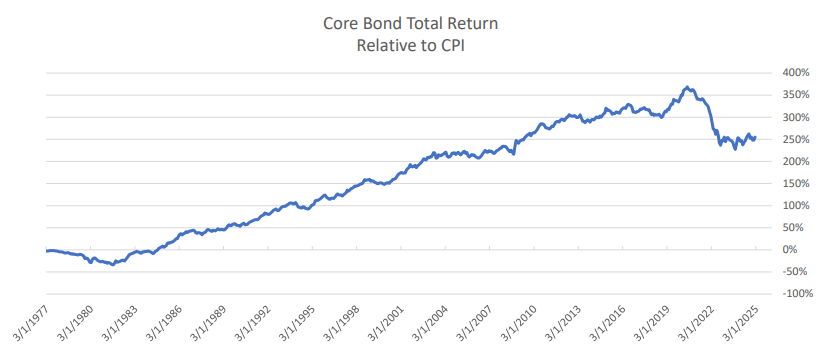
1. Fixed Income Returns
Sources: BTC Capital Management, Bloomberg
- Core bonds have outpaced inflation by 250% since 1977.
- They are currently down 30% from their peak in 2020.
- The ratio is flat over the last 15 years.
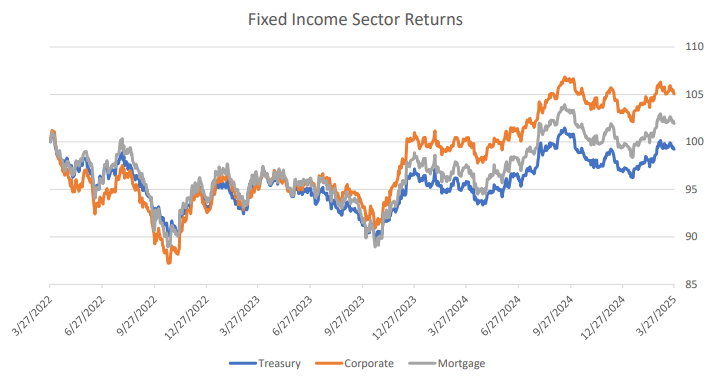
2. Sector Returns
Sources: BTC Capital Management, Bloomberg
- Corporate bonds have outpaced mortgage-backed securities (MBS) and Treasurys over the last three years.
- Typically, corporates outperform if the S&P 500 is rising but underperform when it is falling.
- MBS returns normally fall between corporates and Treasurys.
3. Treasury Yields

Sources: BTC Capital Management, Bloomberg
- Gasoline prices can be a good proxy for the direction of Treasury yields.
- OPEC+ increased oil production in a surprise move.
- Oil prices are down 17% in just over a month.
- The S&P 500 drop has hindered expectations for above-consensus gross domestic product (GDP) growth.
- Tailwinds in place for lower bond yields in the near-term.
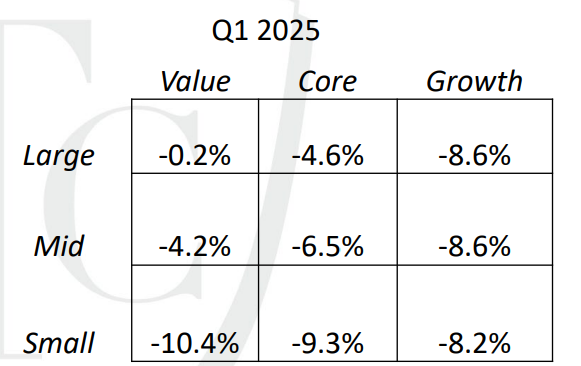
4. Growth Stocks Underperform Q1 2025
Source: PSC Portfolio Strategy
- For the first quarter of 2025, mid and large cap Value stocks outperformed Growth stocks, a reversal from 2023 and 2024.
- Growth stocks sold off significantly during the first quarter as lofty valuations and reduced earnings growth forecasts led
investors to rotate out of longer duration stocks.
- Both foreign developed and emerging markets outpaced U.S. stocks during the first quarter of 2025 as Western Europe
and China stock markets saw upward gains.
5. The S&P 500 and the Terrible, Horrible, No Good, Very
Bad Two Days (April 3-4, 2025)
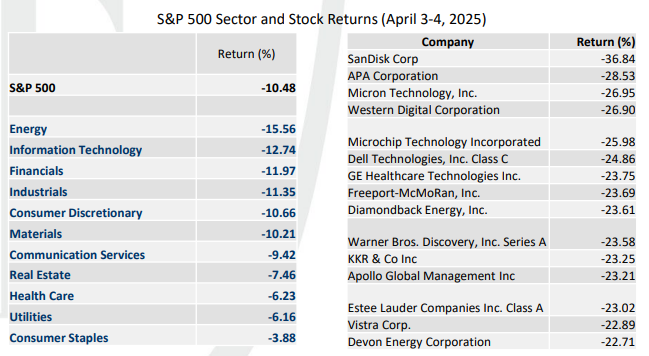
Source: BTC Capital Management, FactSet
- To paraphrase the title of a popular children’s book, the S&P 500 (and most other markets) had a rough couple of days
following the announcement of new sweeping tariff reforms on Wednesday’s “Liberation Day.”
- All sectors in the S&P 500 were negative over the two days, with the Energy sector selling off the most.
- Companies who rely on foreign countries for main production hubs, including technology and apparel companies, saw
significant losses as newly introduced tariff rates specifically targeted those countries.
Investment products and services may lose value, are not a deposit, are not guaranteed by any financial institution, and are not FDIC insured or insured by any government agency.
Sources: BTC Capital Management, Bloomberg, PSC Portfolio Strategy, FactSet
The e information provided has been obtained from sources deemed reliable, but BTC Capital Management and its affiliates cannot guarantee accuracy. Past performance is not a guarantee of future returns. Performance over periods exceeding 12 months has been annualized. This document is intended for informational purposes only and is not an offer or solicitation with respect to the purchase or sale of any security. Statements in this report are based on the views of BTC Capital Management and on information available at the time this report was prepared. Rates are subject to change based on market and/or other conditions without notice. This commentary contains no investment recommendations, and you should not interpret any statement in this report as investment, tax, legal, and/or financial planning advice. All investments involve risk, including the possible loss of principal. Investments are not FDIC insured and may lose value.
|